
Are max hangs all they are cracked up to be? What metrics really matter? aNd how much?
Project Direct coaches take a statistical dive into the strength tests and surveys of 600+ climbers and find some groundbreaking results
By Casey Elliott, BS and Karly Rager, MS
Tl;dr
This analysis shows that weight, gender, height, and ape index do not play a significant role in a person’s maximum sport climbing grade or bouldering grade. The analysis shows the most important factor in getting better at outdoor rock climbing is going climbing outside (crazy!), followed by several varieties of finger strength and upper body strength. However, if you were part of this survey, maybe lay off the hangboarding and get your butt outside. If you want to see how well the multivariate model fits you, head to our climbing predictor here and input all the variables given (Please note, you will not be able to calculate your results until all fields are completed).
Why Do We Care About Statistical Analysis in Rock Climbing?
We are on the cusp of a new era in climbing. Historically, climbers have relied on testimonial training plans and the “secrets to success” endorsed by elite climbers. In this way, the climbing world is far behind other sports that use hard, quantifiable data to influence training plans, draft choices, player values, and more.
Let’s discuss Major League Baseball as a prime example. This sport has more quantifiable metrics than almost any other. Therefore, it has seen the use of statistics and multivariate analysis to evaluate players and the odds of success in the major leagues. One historical, statistics-driven change in baseball scouting was to recruit players by their “on-base-percentage” rather than using physiological attributes like speed and strength. Through this method, abstract attributes like mental toughness, intelligence, and patience can be assessed. The theory is that baseball players can develop speed, strength, and power much faster and more reliably than mental toughness or patience. This alternative scouting method worked with high reliability because it focused on the main aspect of the game: to win, a team must score more runs than the other team. In the end, stacking a team with players that have high batting averages doesn’t directly translate to scoring runs. The moral of the story is to scout or train the variables that actually correlate with winning (or in our case, sending) rather than metrics that may seem important at first but prove to have less value than others, like speed and strength.
So what does this baseball analogy have to do with changing eras in climbing? Let’s go back to the testimonial training theory. Up until recently, coaches and advice columns have focused on what elite climbers did to see success, which at the end of the day, is a very limited, specific data set of few. We could start a podcast and talk to all the strong climbers (which has been done) and then try to find the similarities between what has shown success for them and distill that down. Generally, the climbing community has had relatively good success with that. Without proper statistical analysis we cannot say for certain that the variables the community sees as important truly cause improvement, or are just correlated with improvement.

For example, if every climber from the dawn of sport climbing has said that having stronger fingers is the most important key to success, then everyone trains fingers heavily and sees improvement in their climbing grade, are we actually able to say that finger strength was their biggest key to improving? Could it be that these climbers also climbed more, learned movement skills, acquired redpoint tactics, got stronger upper bodies, started deadlifting, and ultimately could have climbed as hard without training fingers as much or even progressed faster if they focused on other attributes more? Is this socially accepted and universally trained attribute something that we all do or something that we all need to do? And if so, how much?
But times are changing. Companies like Project Direct Coaching, The Power Company Climbing, and Lattice Training are working to create more data-driven answers to these questions. This is where multivariate analysis comes into play. We can survey climbers and test quantifiable metrics, utilize dozens of variables even if they have statistical collinearity (ex: “maximum finger strength” and “maximum number of 7:3 repeaters in a set” will have some physiological overlap) and ask our analysis tool which of these variables demonstrate real influence on the output of climbing harder grades. We can then create a model that weighs the importance of each variable appropriately and outputs a predicted response. If the predicted response is fairly accurate, it means the variables that show importance are truly important.
In short, we could test a climber’s metrics and with a good model, we can predict how hard they “should” sport climb or boulder and what variables played key roles in that output. Pretty neat! And it's something that other sports industries have been performing for years to evaluate how much to pay for players or how likely they are to succeed.
What Variables Did We Have At Our Fingertips?
In this analysis, we wanted to know what are the most important variables that contribute to a climber’s maximum sport climbing and bouldering grades. Or in other words, what are the most important things a person can work on to achieve one specific type of “success” in the sport? We can all have herculean finger strength (or a great batting average), but still not end up scoring runs or clipping chains.
To this end, we obtained a data set of over 600 climbers with a maximum grade ranging from 5.9 to 5.14+ and V1 to V15 that contained the following variables:
age (yrs)
weight (lbs)
height (in)
BMI
wingspan (in)
ape index (in)
training experience (days)
outdoor climbing experience (days)
maximum # of pullups in a set (total reps) - no kipping
amount of weight added to a max hang on a 20mm edge (lbs)
amount of weight added to 1 pullup (lbs) - no kipping
the previous two metrics in terms of strength to weight ratio (lbs/body weight in lbs)
maximum # of pushups in one set
max time on 7s:3s repeater - 7 seconds on a 20mm edge, 3 seconds off, repeated until failure, (seconds)
maximum time on a short campus ladder - feet on, up one down one, (seconds)
maximum time of a long campus ladder - feet on, up two down two, (seconds)
Does Any Single Variable Prove Anything? Also, What The Heck Is R^2? (Skip To The Pretty Pictures and Results If You Hate Math)
We started by performing single variable analysis to see if any single variable had an independent and significant contribution to either maximum bouldering grade or sport climbing grade. We considered gender differences (we also examined this data separately for men and women and did not find a significantly different result—less than 5 percent different!). We also considered linear and non-linear correlation (we examined logarithmic, power, exponential, and polynomial regression patterns and the correlation values were not significantly different than the linear regressions—again, less than 5 percent different), and their relation to sport climbing and bouldering independently.
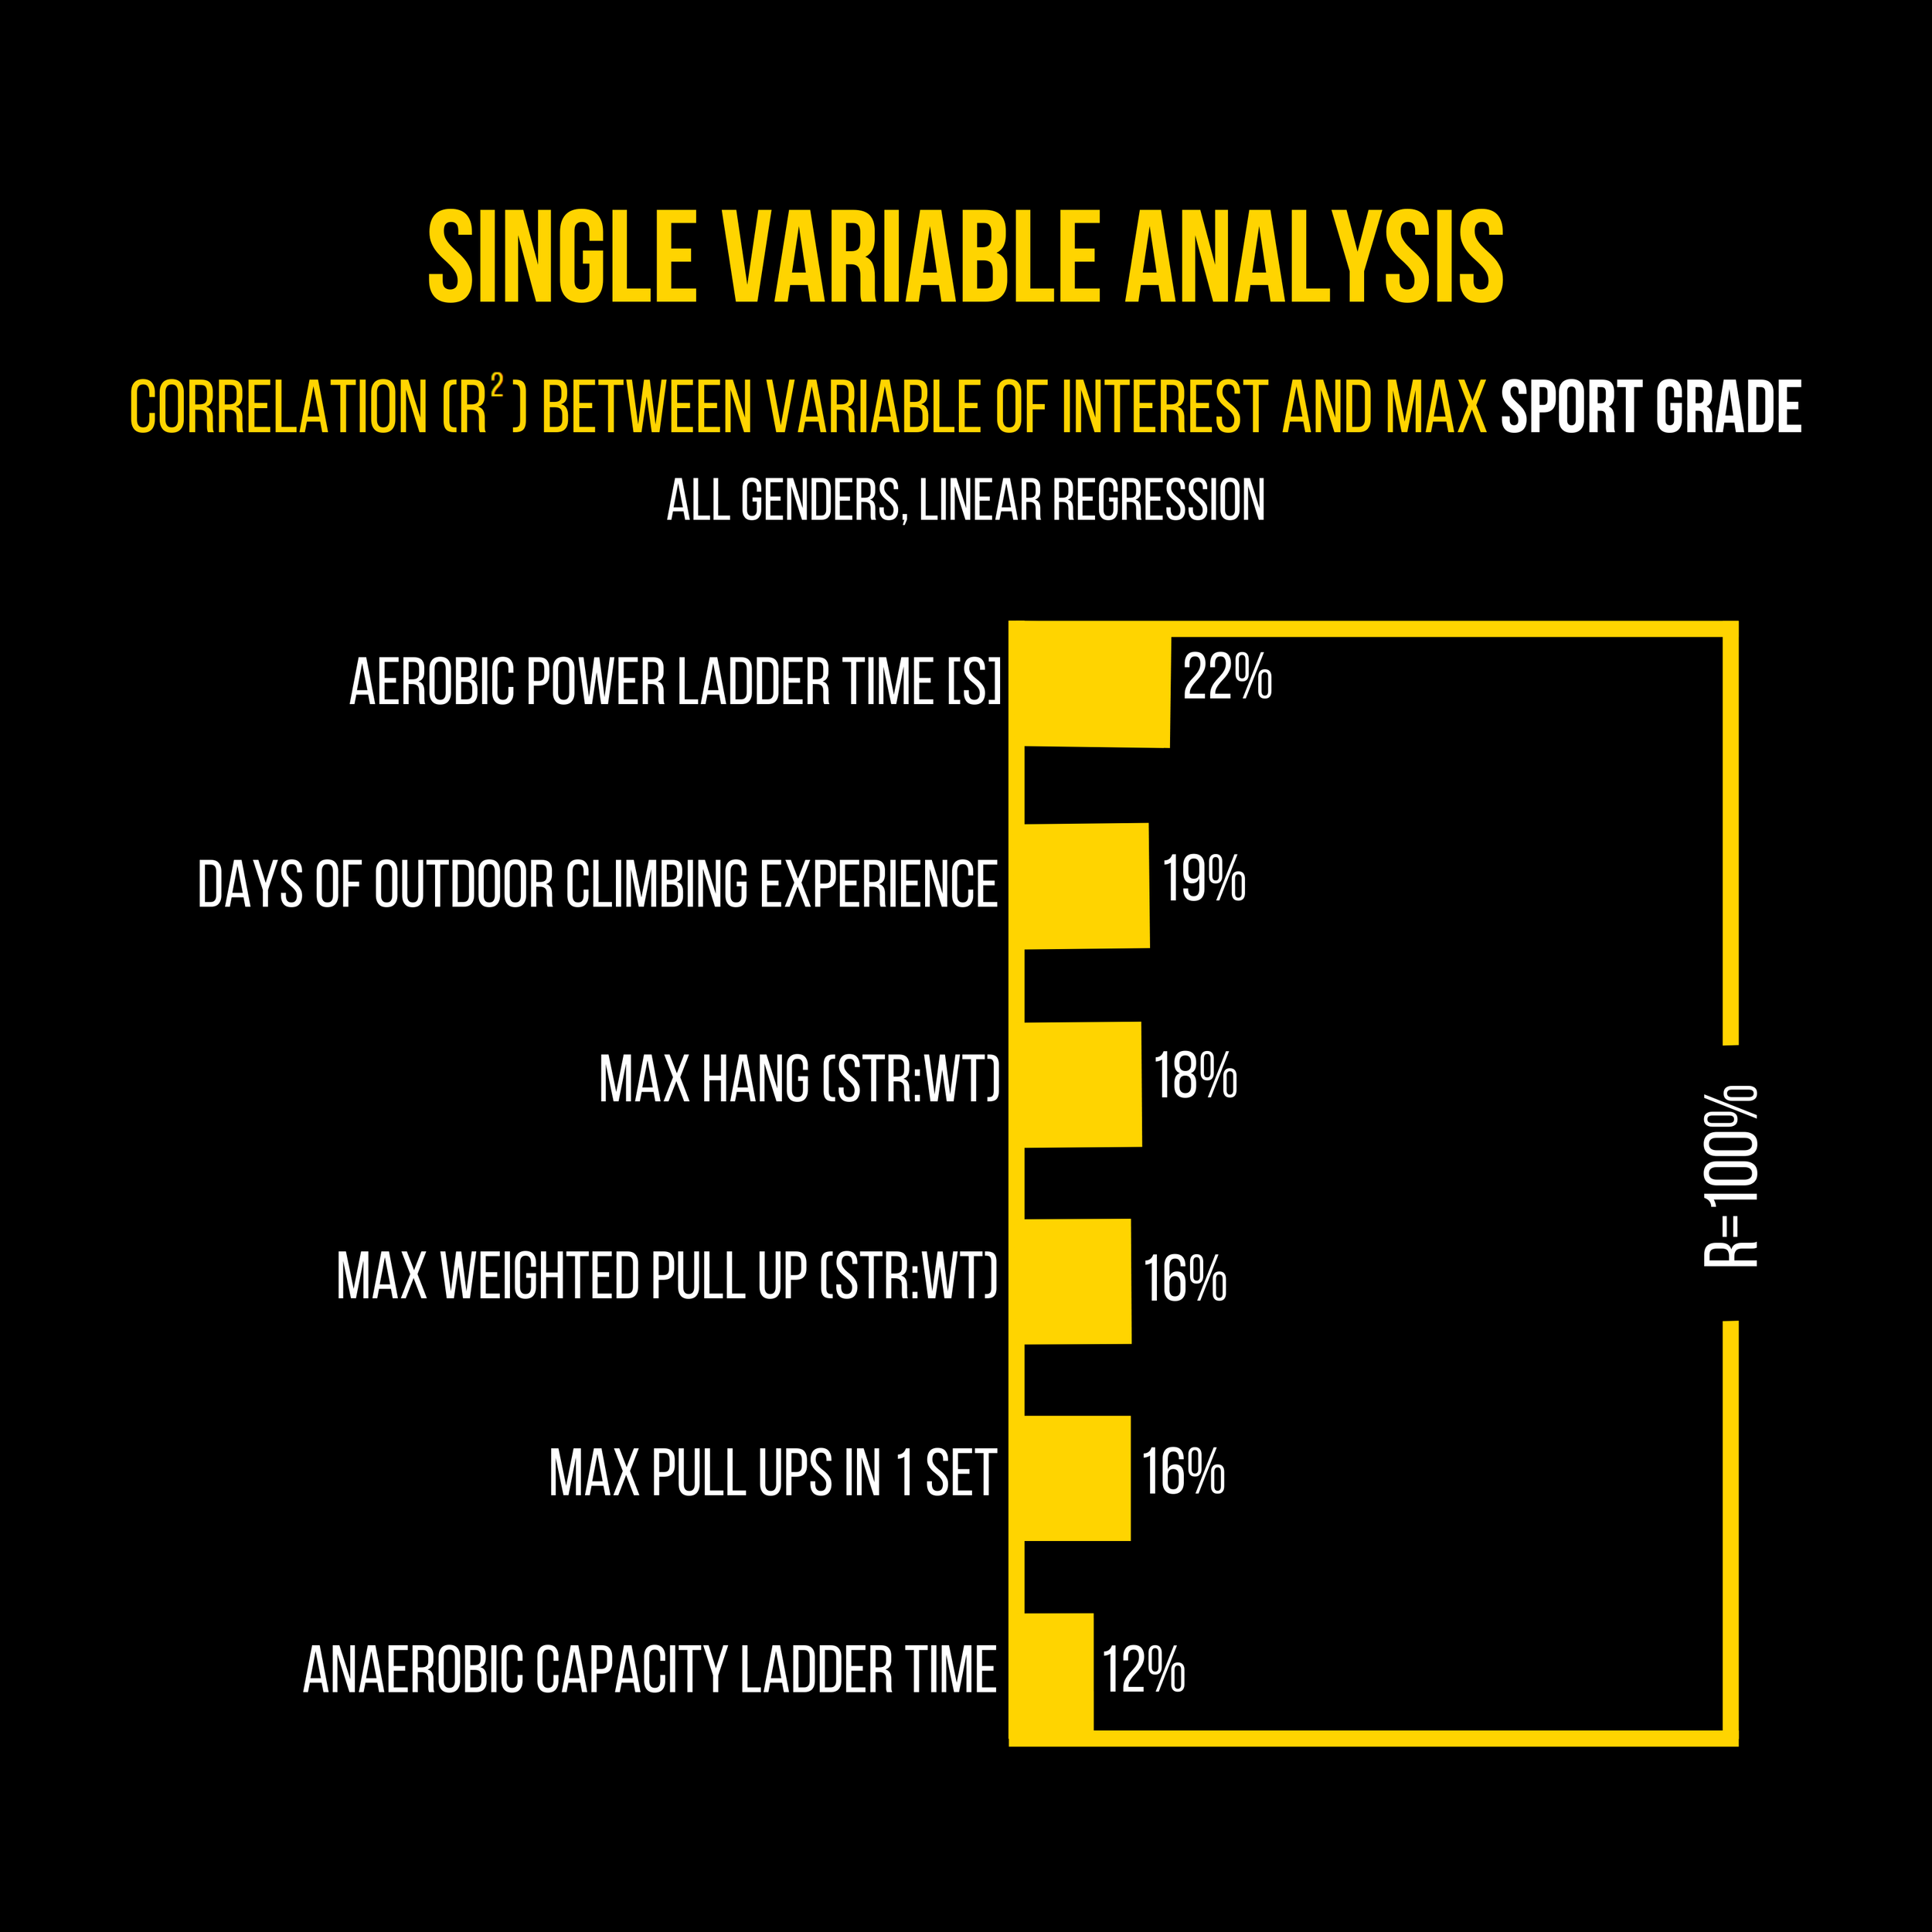
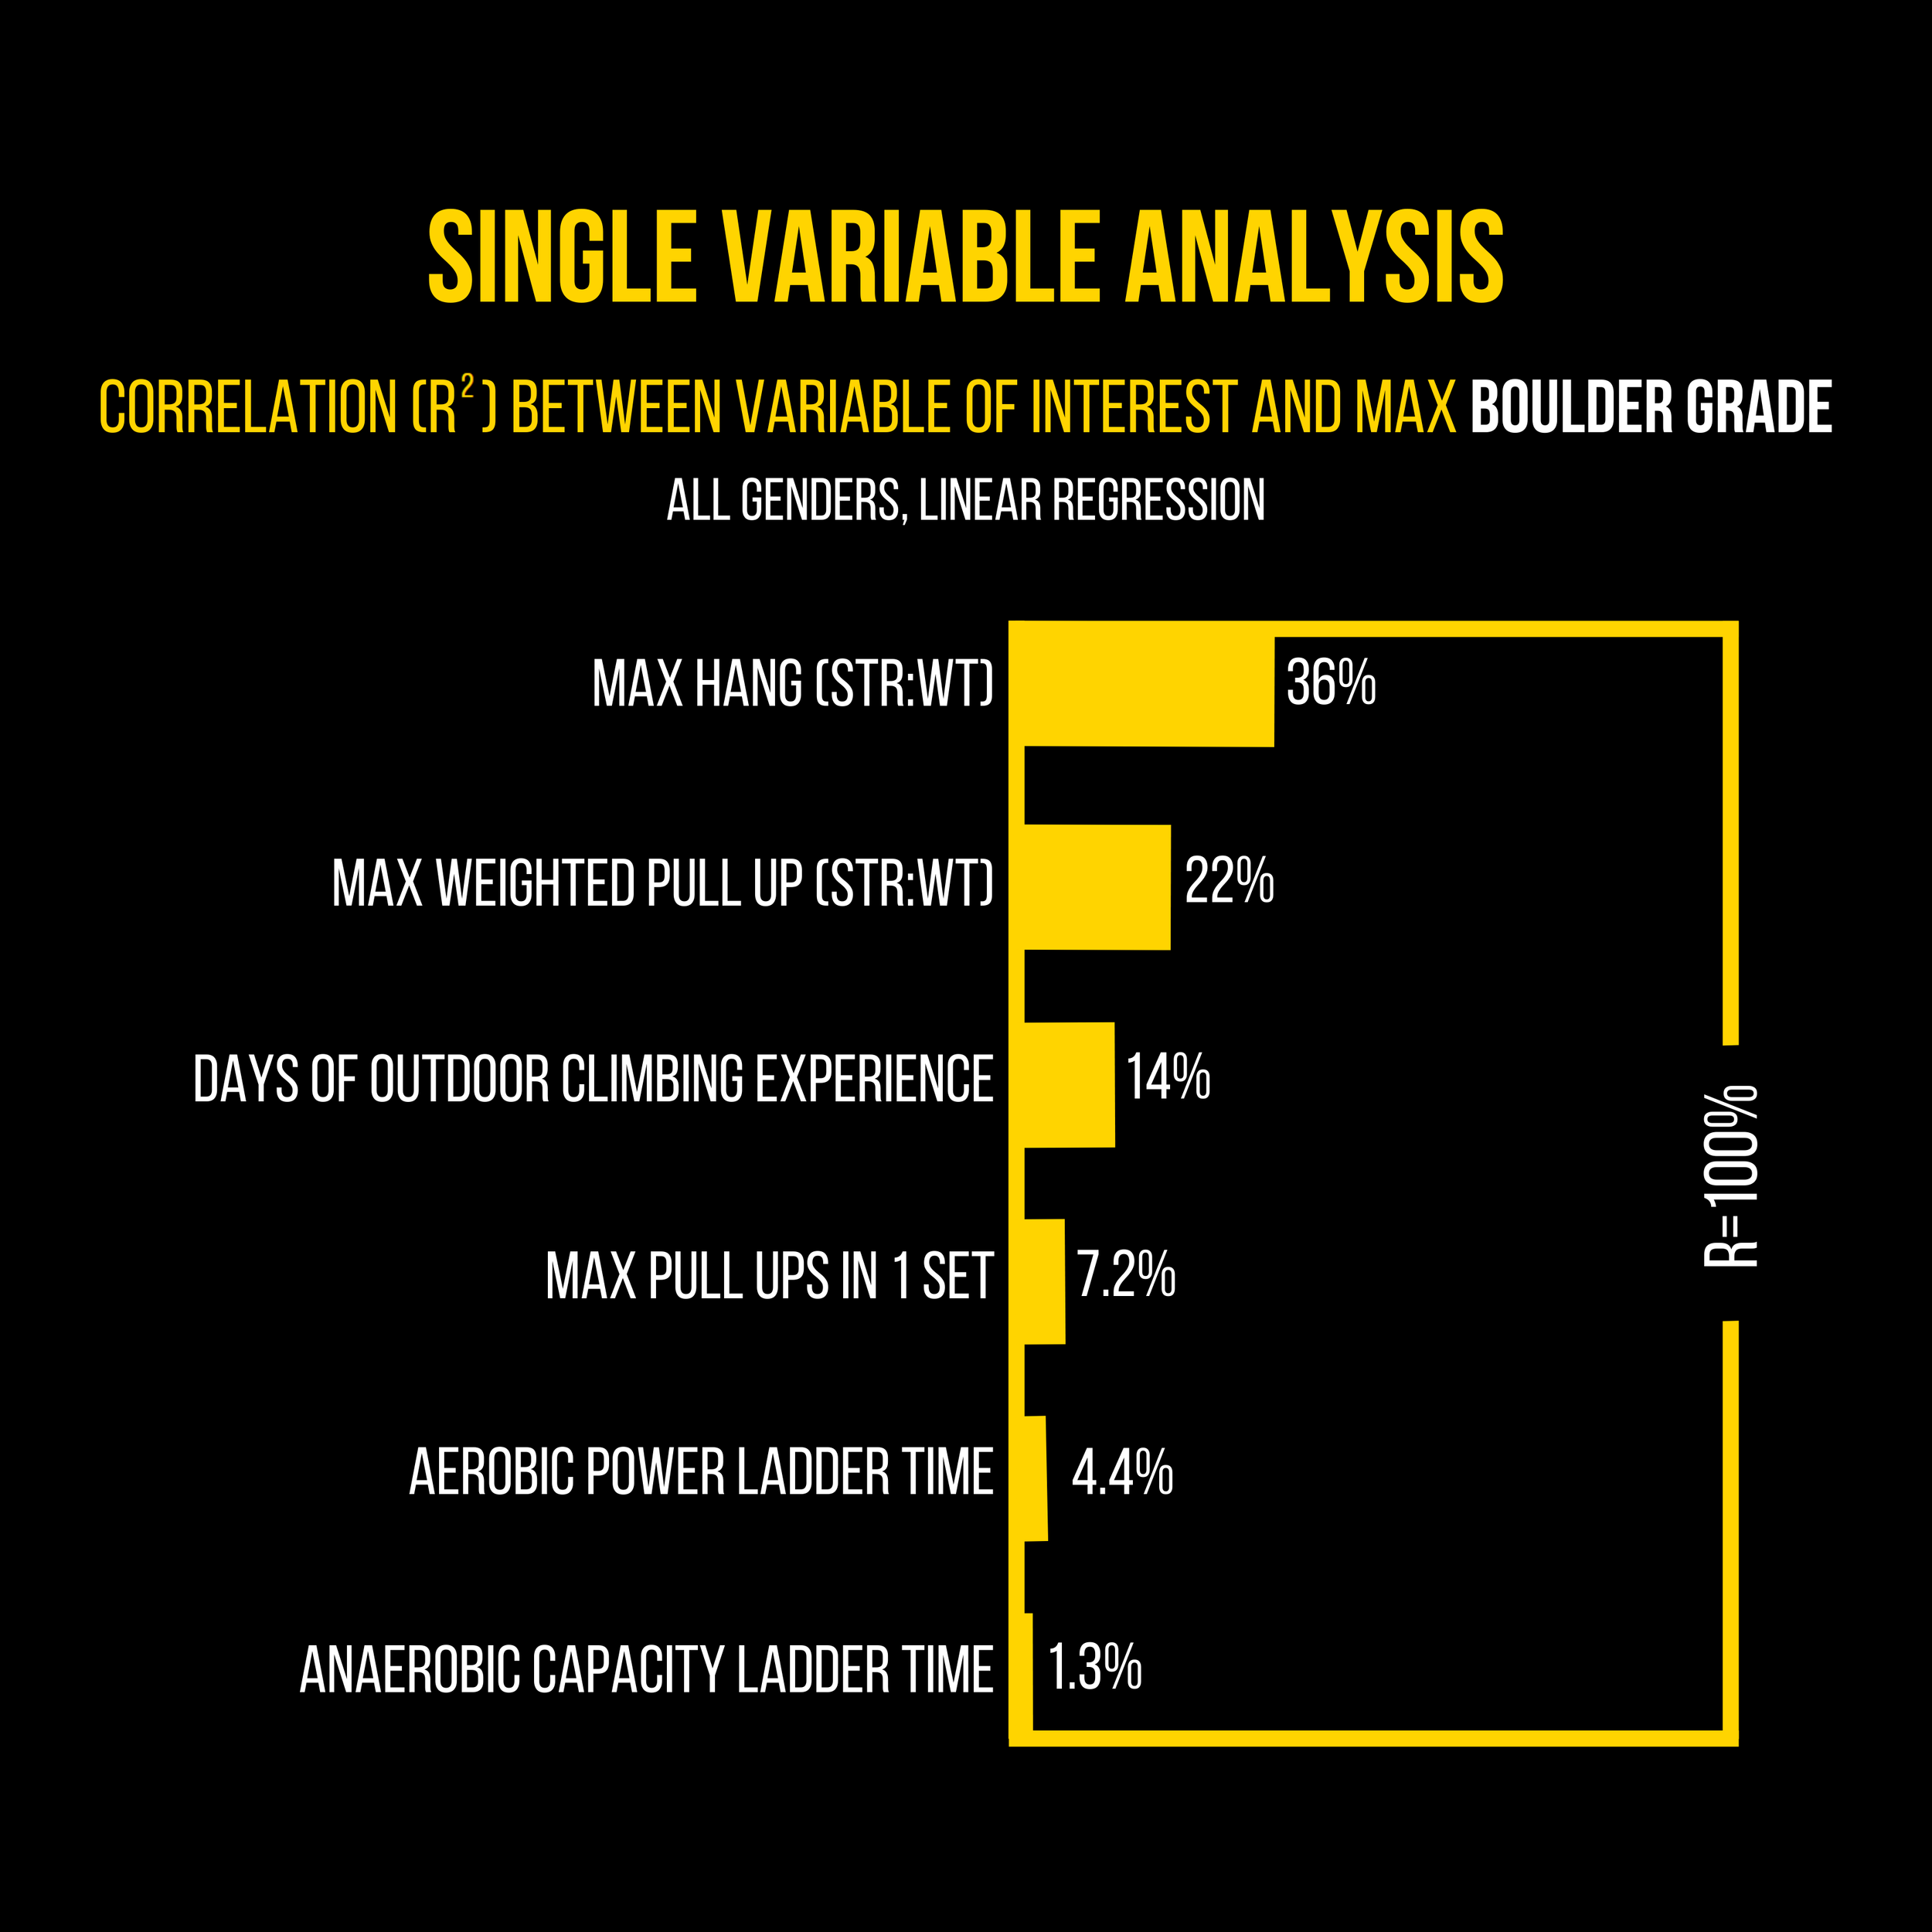
Before we dive further into the results of the single variable analysis (below). It is important to identify what correlation (or R^2) values really mean. Correlation is not causation. Rather, an R^2 of 40 percent indicates that 40 percent of the variance of the data can be attributed to the variable with this correlation. Below is a table indicating the ranges of correlation values. This is vital to understand because when considered in a single-variable analysis, none of the metrics indicated a significant correlation to maximum sport grade and only one indicated a moderately positive correlation to maximum bouldering grade. One metric (max hang, expressed in strength to weight ratio) vs. bouldering grade showed a moderate correlation.

Our Process Of Using Multivariate Analysis in Climbing
While single variable analysis gave some insight, we wanted to use all the variables at our disposal in a single model, just like the baseball analogy. To achieve this, we employed a partial least squares (a form of principal component or multivariate analysis) to see how much of an impact each of the following variables had on a climber’s reported maximum sport and bouldering grade when considered all together.
While all of these metrics must be generally quantifiable, some of them are physiologically based and some are skill based. An example of a physiologically based metric is maximum finger strength. While it does take some coordination to perform the perfect hang, it takes a fraction of the skill than outdoor climbing requires. The two variables in this set that show a higher relation with skill development are: “outdoor climbing experience,” and “training experience.” We included training experience because it represents a commitment to structure that overlaps with directed climbing practice and a commitment to learning.
We performed the partial least squares regression on the set of climbers including all the independent variables bulleted above, and used maximum sport climbing grade and maximum bouldering grade as the dependent variables. We accounted for the collinearity between the variables and created an optimum set of factors that best fit the data set. Then, the multivariate analysis calculated three very important things:
It showed which variables were statistically significant (when all variables are considered together) and which ones did not have a high enough correlation with the output to be deemed significant. This is useful for attaching meaning to the data and is the meat of what we will talk about.
It assigned a weight to each variable for both sport and bouldering separately that allowed us to create models that can predict a climber’s theoretical maximum sport climbing or bouldering grade.
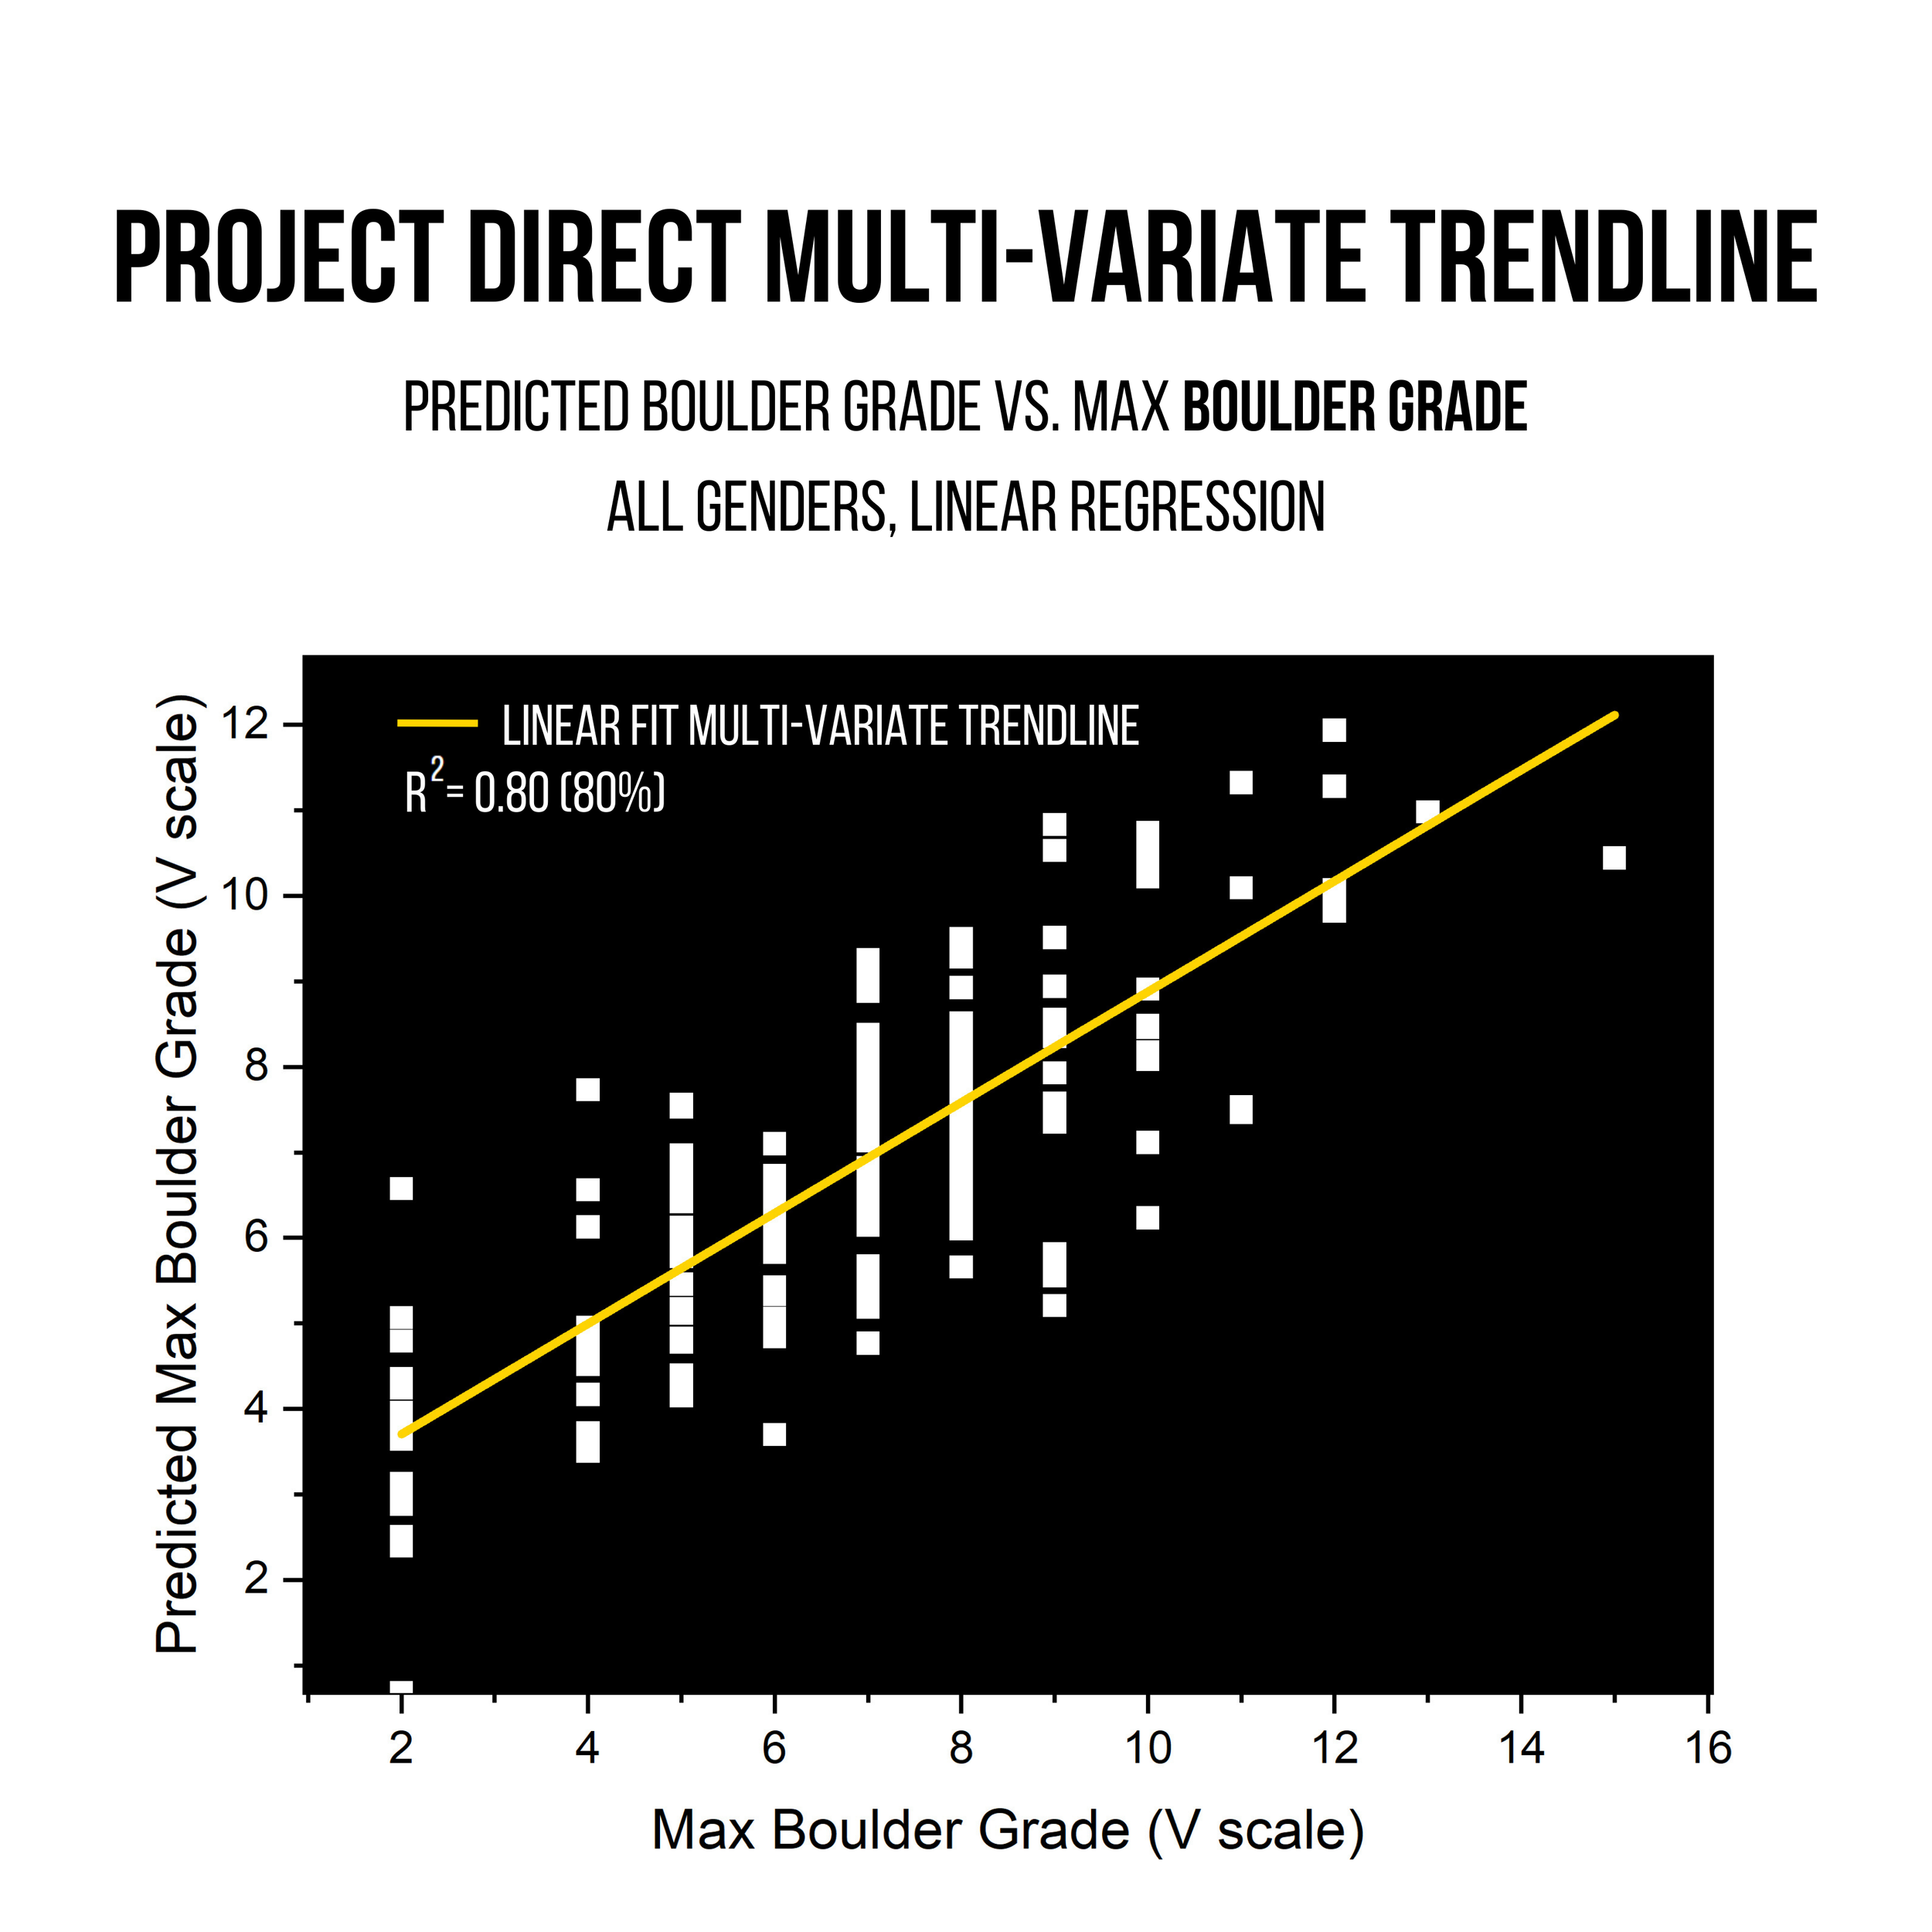
It assigned an R^2 value to the new, multivariate model which indicates what percentage of the variability in output can be explained by the model (or in other words, how well does the model predict the outcome).
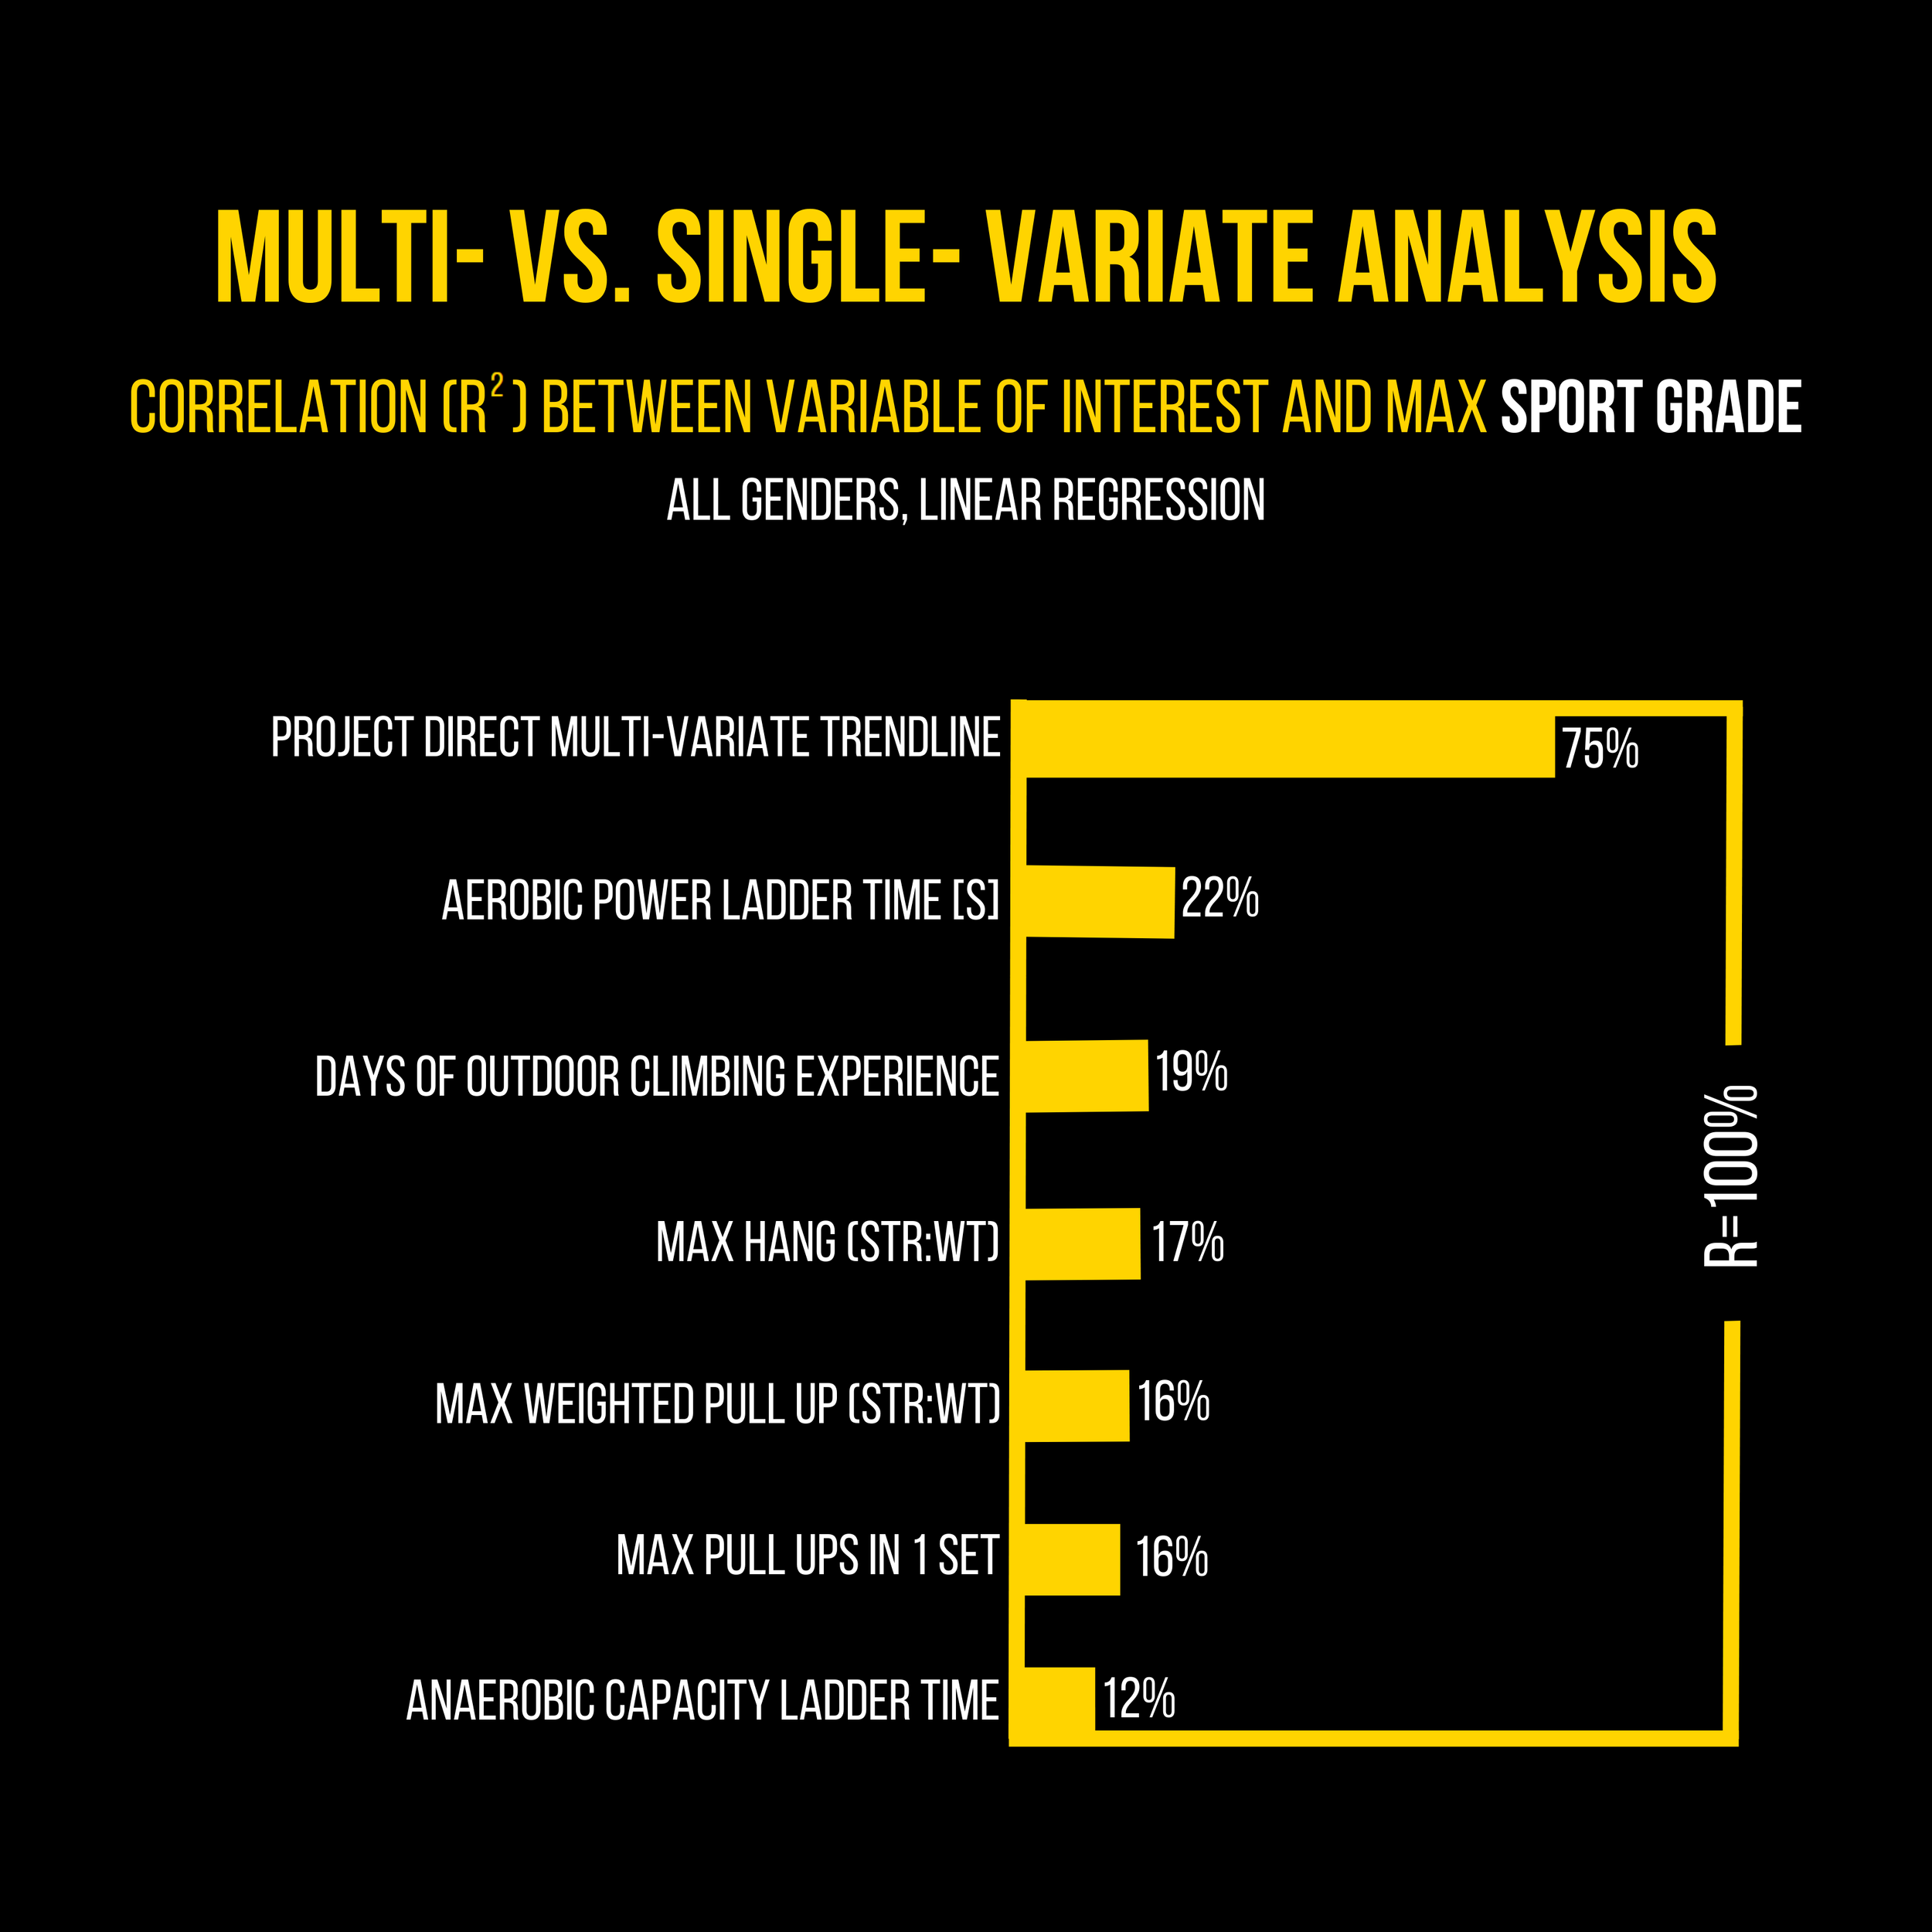
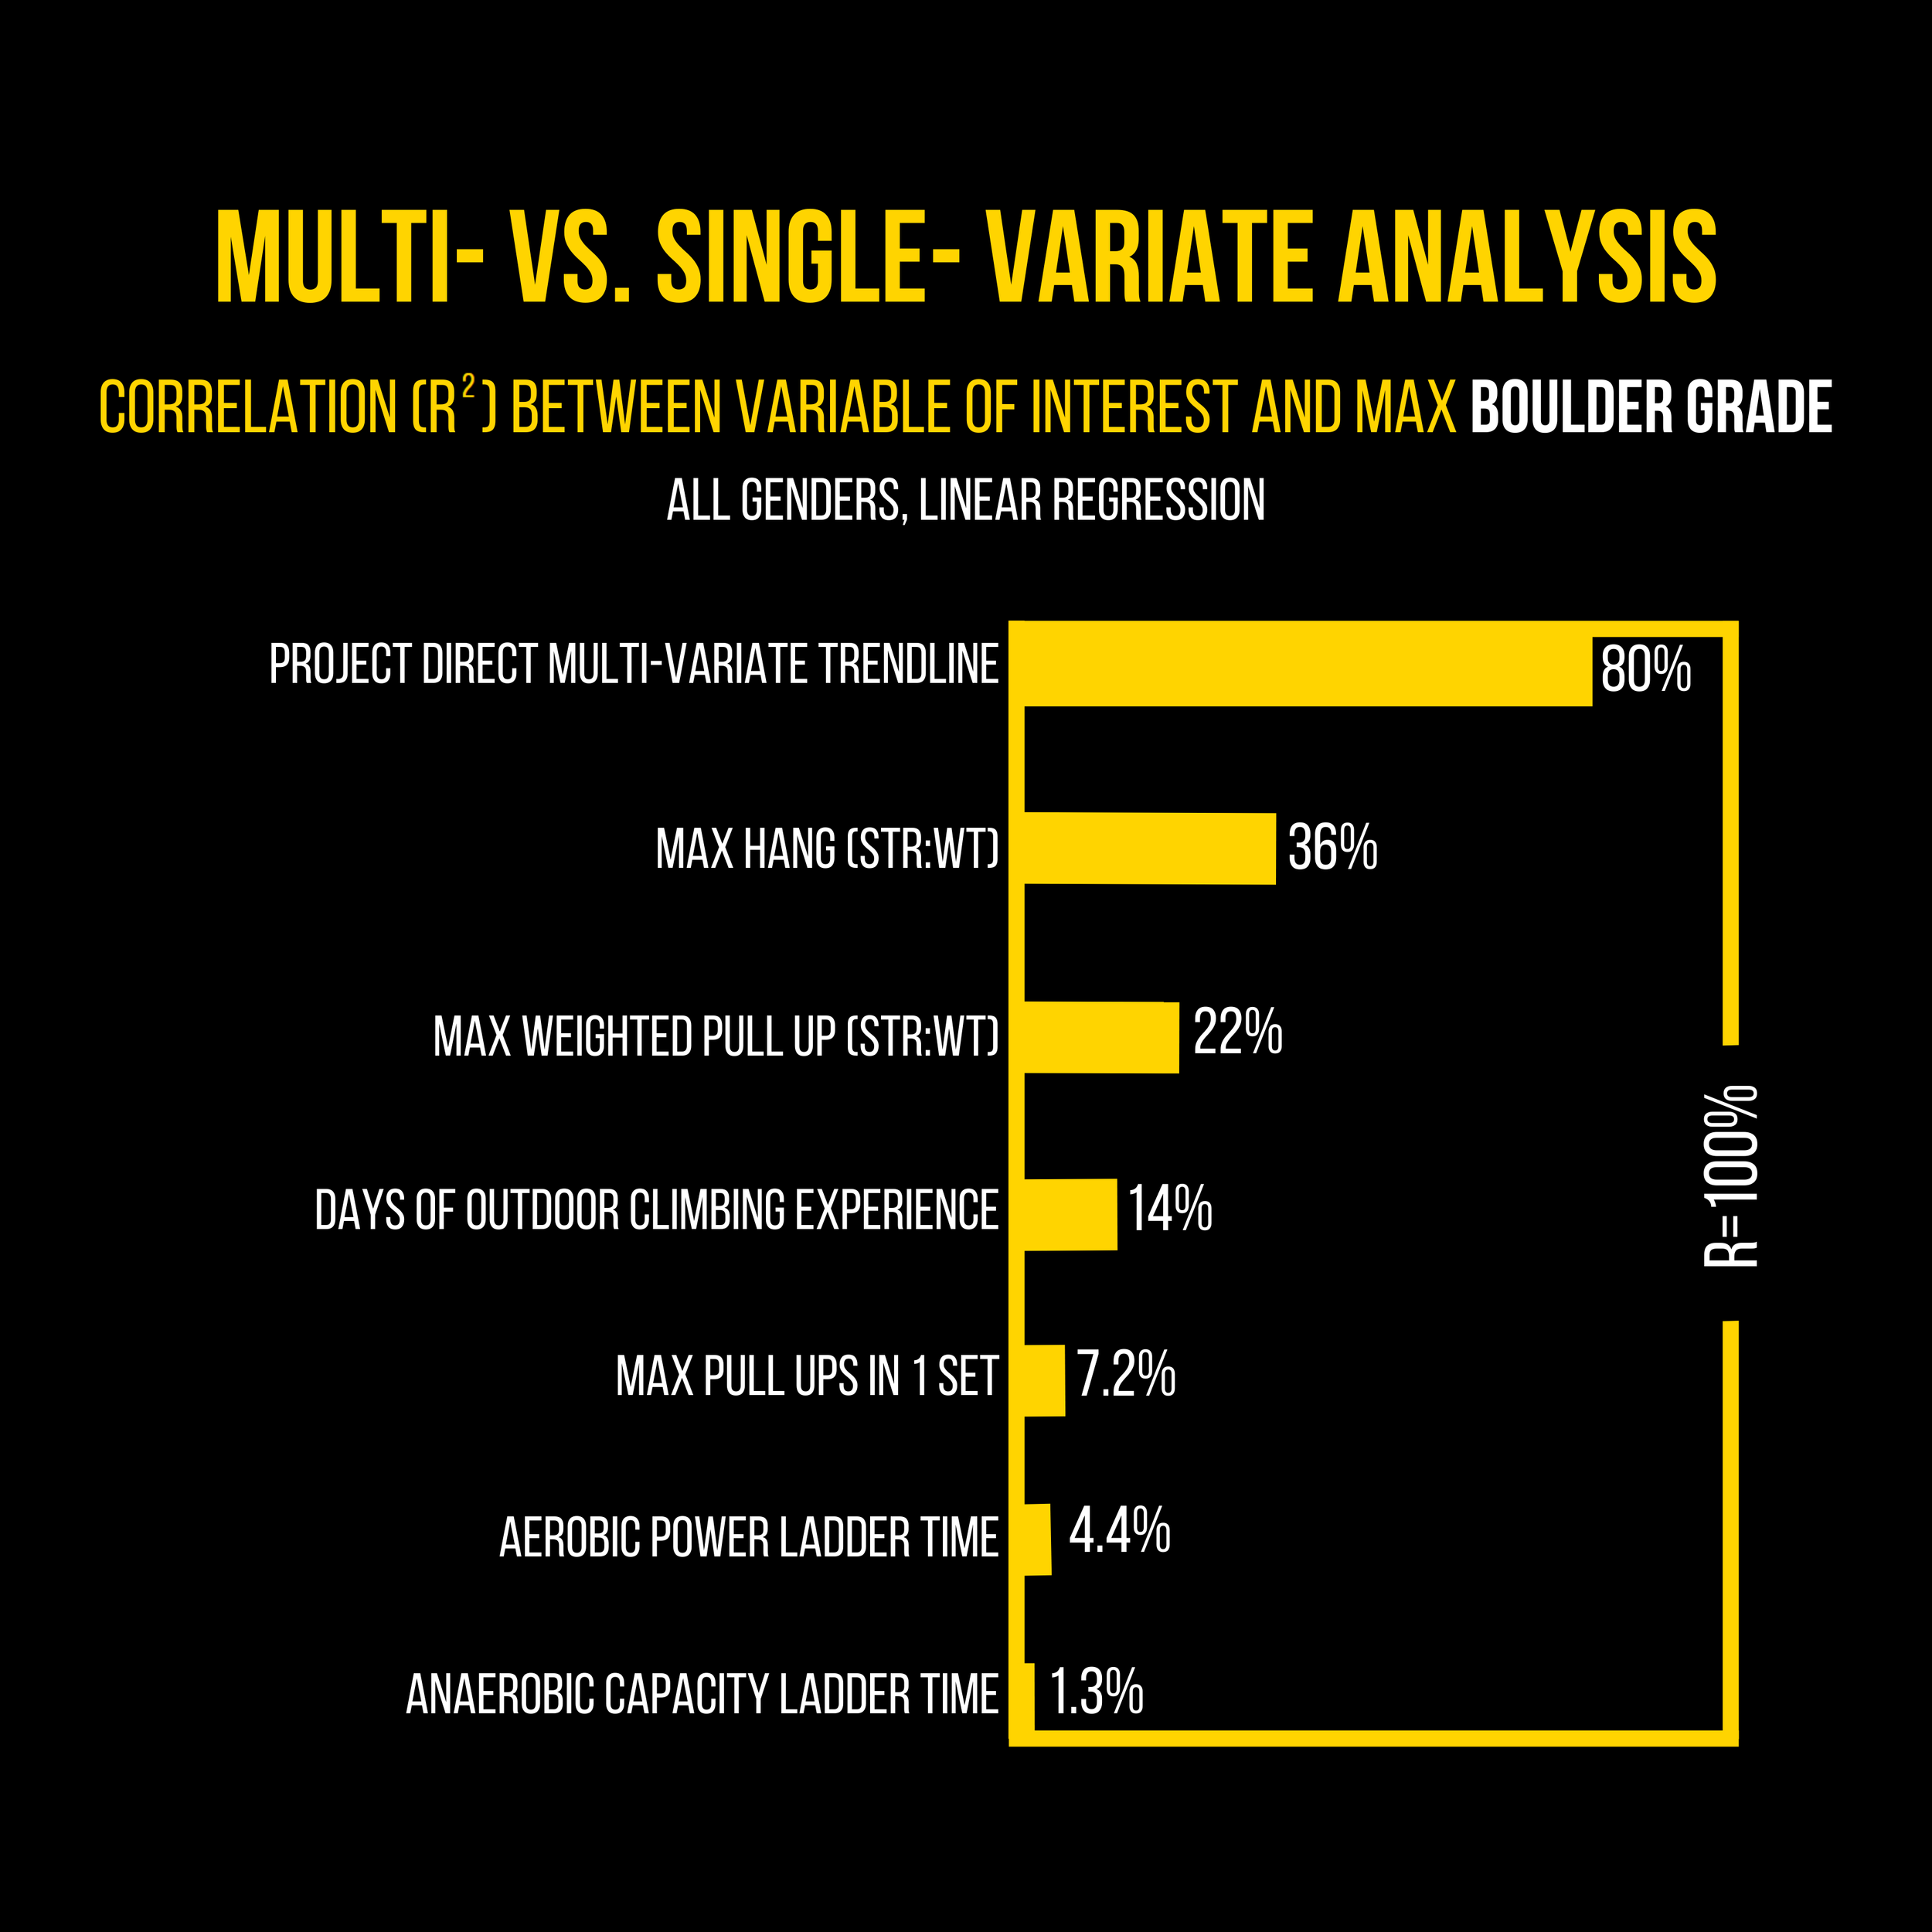
As shown in the images above, models created using any single variable on the list have R2 values between about0 percent to 22 percent (for sport climbing) and about0 percent to 36 percent (for bouldering). This means the single variable models can explain a maximum of 22 percent or 36 percent of the variability in the outcome in sport climbing or bouldering, respectively. As the standard for “moderate positive relationship” sits at 30 percent, we can say that no single variable can get in the ballpark of predicting sport or bouldering grade. Especially when we look at how many variables we have, and how much they overlap (physiological eigenvalues of max hang vs. repeater data). If we added up all the correlation values for all 15 variables, we would have higher than 100 percent which indicates that a good portion of those values are, without a doubt, only showing correlation.
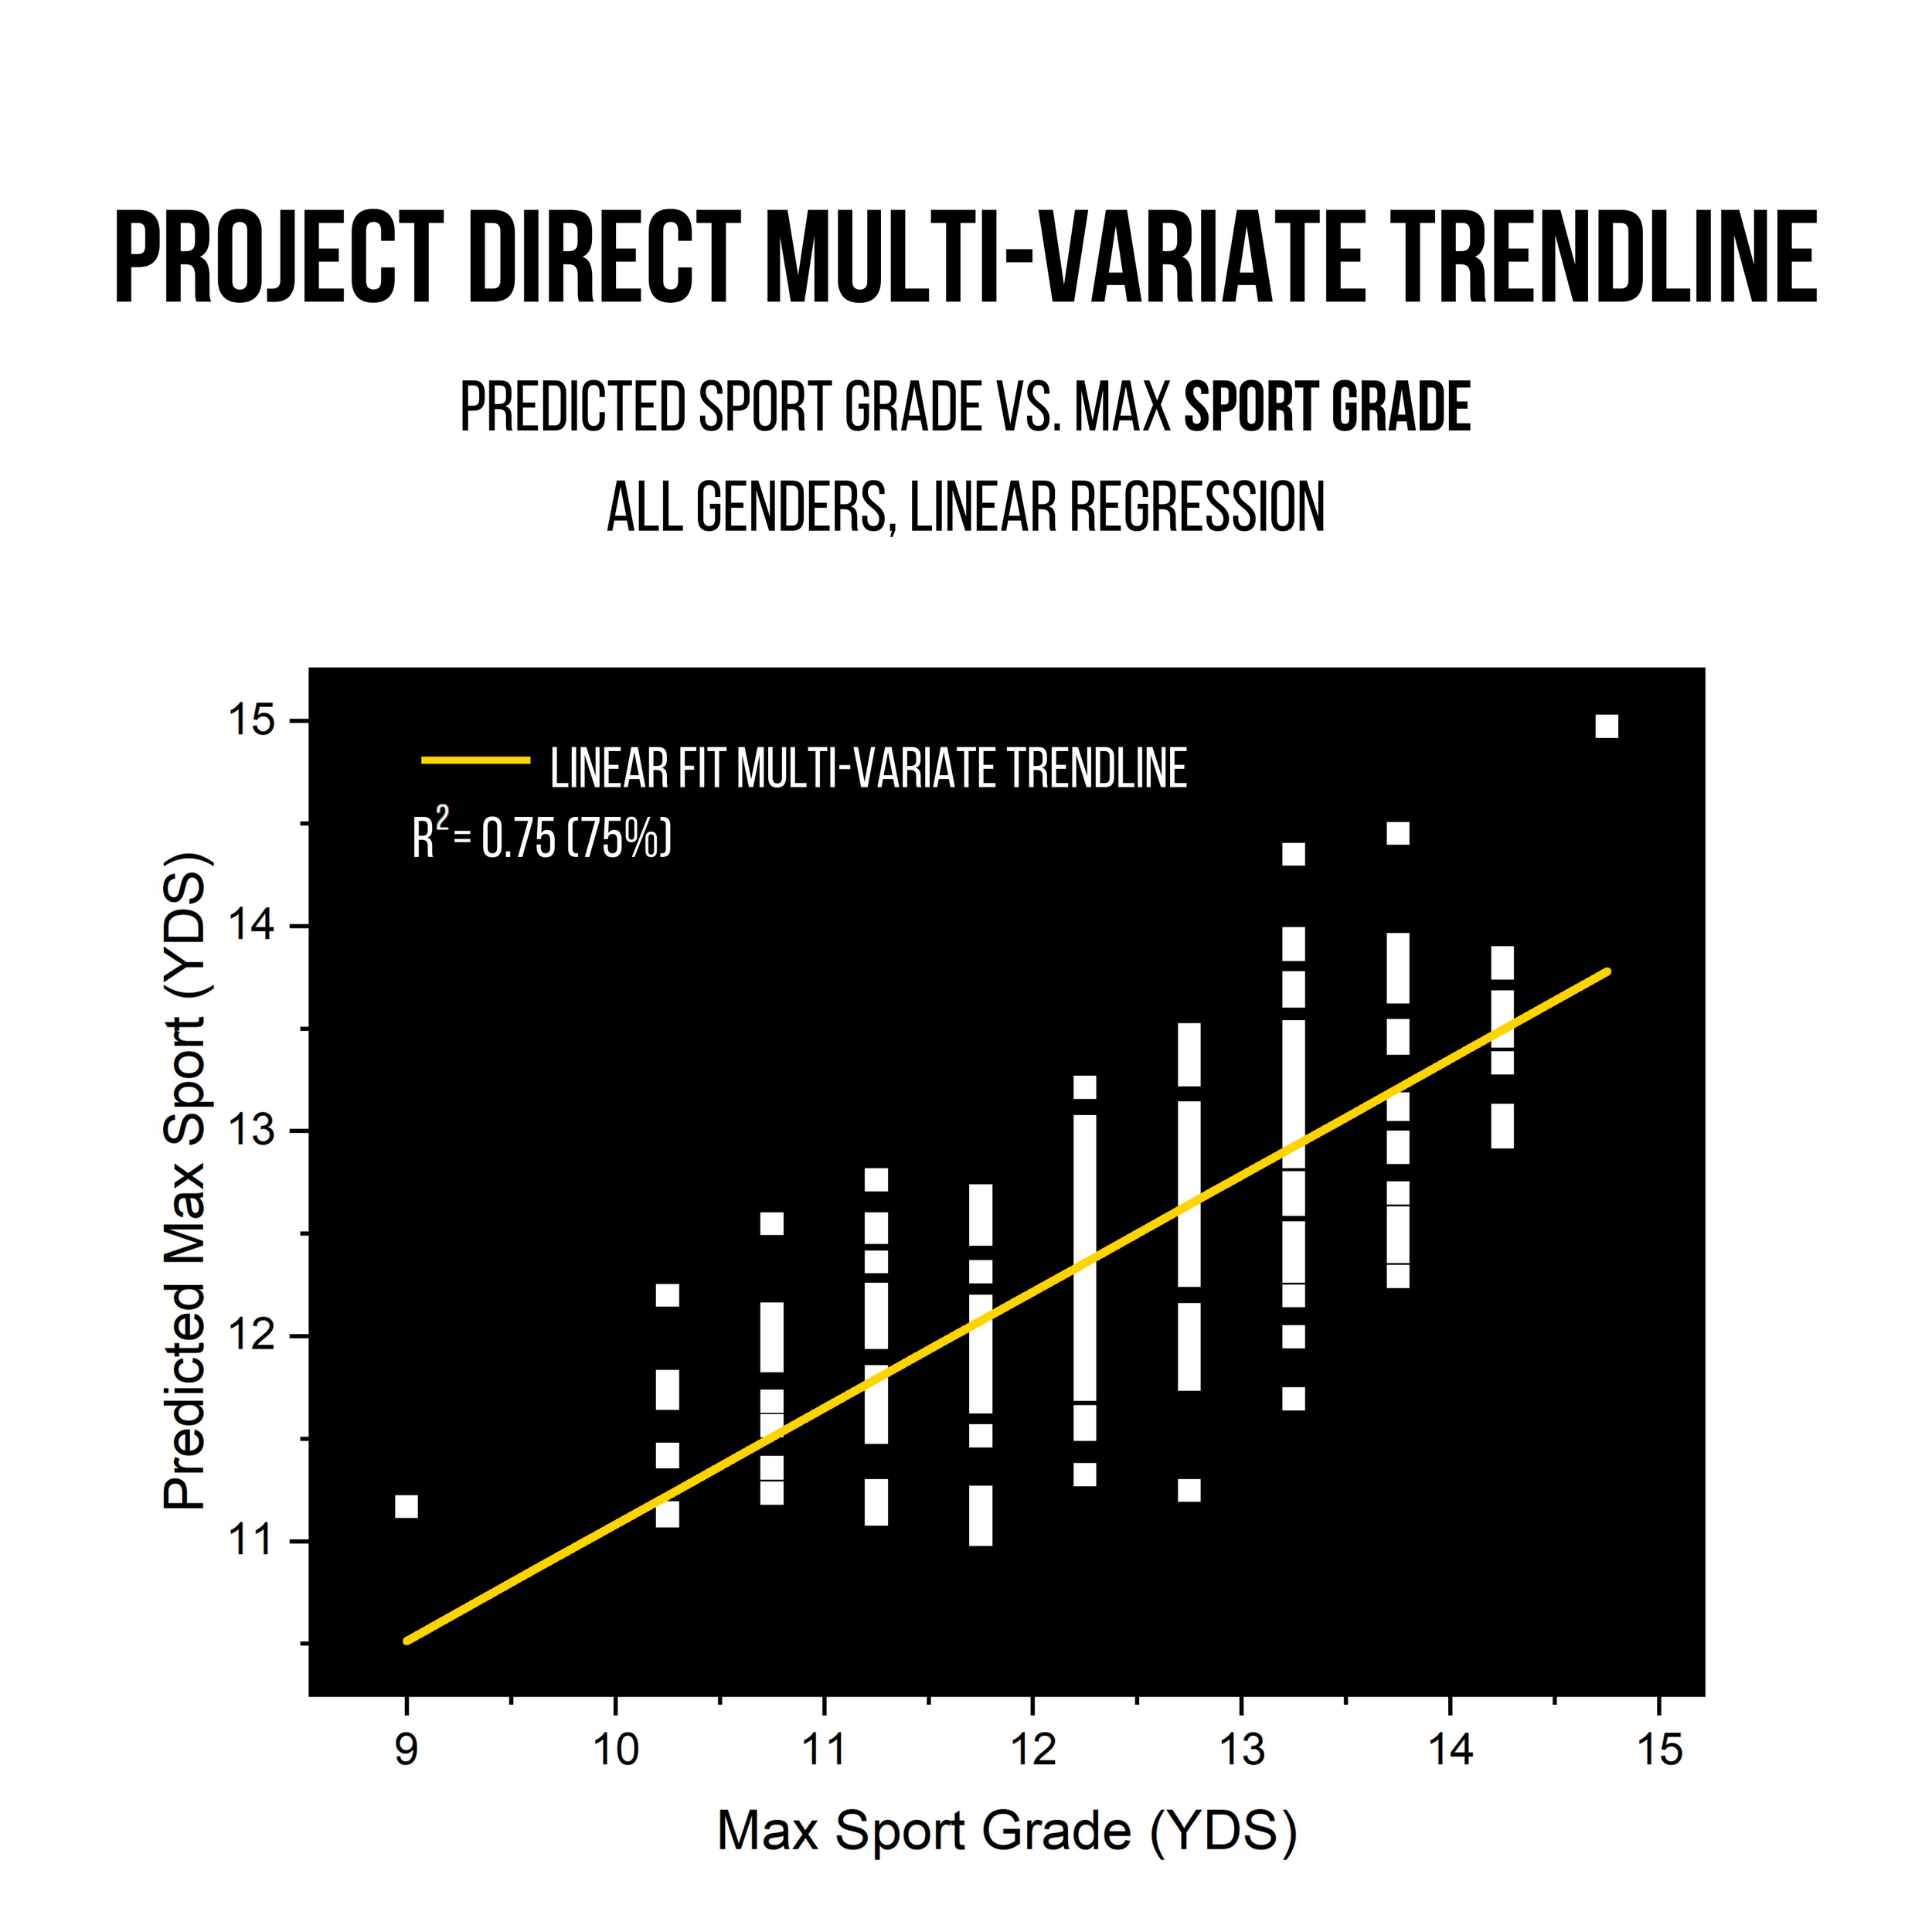
The Project Direct multivariate models show R2 values of 75 percent to 80 percent. This means the line or equation we calculated is four to eight times better at predicting maximum sport climbing and bouldering grade and tells us how strongly each variable is adding to that relationship, which is a massive improvement from single-variable analysis trendlines (the better the correlation, the more accurate the variable importance values are).
You could think of this as the ability to predict a climber’s maximum grade more frequently and with smaller error. However, with all this data, this line still only accounts for about75 percent to 80 percent of the variability! That means about25 percent to 30 percent of what makes a climber successful is still out there in the ether waiting to be captured, have the fun beaten out of it, and enumerated like a front range trail runner making us all feel bad on Strava. The darkest corners of the mysterious universe still remain! But some elucidation to this multivariate question has been gained, as was our goal.
THE RESULTS

So what are the most important variables based on the regression? For the full spray, check out the graph and the bullet points below, as we have gone through each variable individually to talk about their significance and effect on maximum climbing grades! The variables that fall under the red-dashed line are not statistically significant and the variables that rise above the line influence the outputs (maximum grades climbed) in a statistically significant way.
Hopefully this can be the final word in every height and ape index debate. Here you have it folks! Height, gender, weight, wingspan, and ape index showed no significance in predicting sport climbing grade. How cool is that? We are terribly sorry to take away the topics everyone loves to complain about and sure, there are absolutely times where it pays to be taller or smaller or have longer arms, but in terms of a climber’s glass ceiling, their ape index isn’t playing a factor in shattering it.
Gender - When we started this analysis, we found that gender did not show significance, so we removed it as a separator and considered all genders together in the data set shown above. It also allowed us to include participants who did not identify as male or female.
Age - This variable proved to be significant. It showed a small, negative effect on the regression line meaning the older the climber is in this data set, the lower their maximum climbing grade. It is important to consider that age incorporates many unknowns that do not directly relate to physical acumen such as starting a family, work, available time, etc. Considering how important and positively correlated “outdoor climbing experience" was, this shouldn't be considered a serious deterrent from climbers starting at an older age. Units are in years.
Training experience - In some iterations of the analysis, training experience showed significance, however in the final iteration, it did not. Training experience is one of the variables I would consider to show a combination of skill and physical fitness as it implies a more serious dedication to climbing. Units are in years.
Outdoor Climbing Experience - The MVP of VIPs! This showed the greatest significance in predicting a climber’s max bouldering and sport grade. WOW, groundbreaking (sort of)! While this has been stressed as important time and time again, it seems that people don’t fully believe it and want a “get strong quick” gym routine. But, here we have the data showing that there is no shortcut in the gym that can alleviate the need for time on the rock. Again, this is based on a single data set, but for the climbers surveyed, outdoor climbing was a more important variable than any finger strength or pulling strength metric. We could play devil’s advocate and say that nobody in this data set knew what they were doing, and took a very long and arduous approach to getting better at climbing. That would indicate this regression line shows the most important variables to get better slowly. Or, we could assume these people were incredibly dialed, knew the shortcuts to success, and this analysis is pure gold. We would love to do this analysis on World cup climbers, or professional climbers and see what variables change. Shit, even just give us the three Alexs and between them we probably have a decent chance of seeing some changes in the variables. In reality, there are surely people in this data set who are mega dialed, and people who are not, giving this data set a decent chance at being highly representative for the vast majority of climbers reading this. Units are in days. We multiplied the number of years a person has been climbing consistently by the number of weeks they climb outside and the average days per week that they climb outside in their season.
Height - Simple. Not significant. Units are in inches.
Weight - Not significant! NICE! This actually showed up in an intriguing fashion. It is the principle reason that the variables “maximum weight added to a pullup” and “maximum weight added to a pullup in terms of strength to weight ratio” influenced the data in virtually the same way. Sidenote: This variable did not follow a normal distribution*. When we calculated the BMI statistics for the surveyed climbers we found the minimum BMI in the study was 10, and the maximum was 41. The average BMI was 22.6 with a standard deviation from that average of 2.59 (giving a range from 20 to 25 for the vast majority of the survey). Seeing as the healthy range given by the CDC for BMI is 18.5 to 24.9, the majority of climbers in this study were in the healthy BMI range. As a disclaimer, weight might be significant if we included every person in America, but if you are moderately close to the healthy BMI range, it doesn’t statistically matter how much you weigh. For example, if you are 5’8”, this says that you can range from about 120 to to 170 lbs and still fit into the healthy BMI range. That's quite the range. When we got into climbing, we were told it was easier to get 5 lbs lighter than 5 lbs stronger. Looking back, we feel like we were partially robbed of the opportunity to get stronger in the long run because once you regain the weight, you are back to where you started. In contrast, after you stop training strength, it sticks around. Hopefully this means we can drop the weight part of the conversation off the table for the most part. Tight tight, we love that. I say “for the most part” because we do not have enough data on climbers above 5.14+ and v13, and we are unable to draw conclusions about the ultra elite. Units are in pounds.
Wing Span - Not significant. We also previously analyzed ape index, and it also showed no significance. Units are in inches.
Maximum Pull Ups in 1 set - A metric that matters. This has shown a positive effect on climbing grade. People that could do more pull ups in this data set could climb harder. Units are the quantity of pull ups a climber could do in a single set.
Maximum Push ups 1 set - A metric that mattered. Funny enough though, this metric showed a negative influence on maximum climbing grade. That means people in this data set who could do a lot of pushups didn’t climb as hard as those who couldn’t. This is the fun thing about experimental data like this, it shows what “is” and/or not always what we expect. We think it's a great idea to focus on opposition to stay healthy and even increase your compression skills. We wonder if a lot of people in this data set do crossfit more than they climb? Units are the quantity of pushups a climber could do in a single set.
Continuous hang - Another finger metric, mostly related to finger endurance. This showed a significant and positive influence on climbing grade. This is measured by timing how long you can hang on a 20mm edge at body weight without taking a break. Units are in seconds.
20-mm Max Hang (total pounds added) and 20-mm Max hang (strength:weight ratio) - Now to the meaty, juicy stuff that everyone loves. This is a finger strength metric and is measured by testing how much weight you can add to your body while hanging on a 20mm edge for 7 to 10 seconds. This showed a significant and…. negative correlation to climbing grade! What? Okay, we all know stronger fingers mean climbing harder, but why is the data showing this as a negative factor? Our best conclusion is the same as with the push ups—too many people in this data set trained finger strength and did not spend enough time actually climbing outside. They have stronger fingers than what the regression line says they “should’ be climbing. As coaches of over 200 athletes, what we have seen is that raw finger strength is stressed too much in comparison to skill building, especially when it comes to sport climbing. Due to the non-significance of weight as discussed earlier, these two metrics showed a similar effect on the data. The collinearity between these two variables shows that the amount stronger we get is as good of an indicator as strength to weight ratio. Units are in pounds added or pounds added plus divided by body weight.
Max Weighted Pull Up (total pounds added) and Max Weighted Pull Up (strength:weight ratio) - This is an upper body strength metric, and is found by testing how much weight you can add to a single pullup. This metric showed a significant and positive relationship with climbing grade! This was actually the second most important variable in the entire set. While this could mean that weighted pullups are incredibly important and the secret key to success, it could also mean the climbers in this survey trained weighted pull ups the proper amount in comparison to how much they climbed outside or found success climbing outside. This metric showed a huge importance on bouldering grade and less importance (but still positive and significant) for sport climbing grade. Again, relating this to weight did not show much of a change in the variable effect on grade. Units are in pounds added or pounds added plus body weight divided by body weight .
Repeaters - Significant and positive. This is calculated by timing how many sets of 7 seconds on, 3 seconds off repeaters on a 20mm edge a climber could do in a row without stopping. This is a good metric of finger endurance. Units are in seconds and include the 3 seconds of resting between each 7 second hang.
Anaerobic Capacity ladders - Significant and slightly negative. This test is done by using a campus board. With feet on, move up two rungs on the ladder with one hand, match, then return to the starting position with one hand, match, and repeat until failure. Measured in total seconds. This metric is more difficult to test reliability across many climbers and gym set ups. We do question the validity of the repeatability and accuracy of this variable and the aerobic power ladder (below) due in part to the variety of foot holds options and campus ladder edge sizes.
Aerobic Power Ladder - Significant and positive. This test is the same as the last, except moves are made one rung at a time. Measured in total seconds. This metric is more difficult to test reliability across many climbers and gym set ups. We do question the validity of the repeatability and accuracy of this variable and the anaerobic power ladder (above).
What Can We Conclude From All these Numbers? (Other than you should have paid better attention in stats class?)
We are psyched about the results because it reaffirms that as a climber, if you want to get better at climbing outside, going climbing outside is the most valuable part of the process! It also shows that anyone, regardless of height, gender, wingspan and weight (healthy BMI) can achieve high climbing grades with enough skill building and strength training. Our basic and unchangeable attributes do not hold us back, statistically.
If you aren’t able to climb outside, the next best thing is to climb inside but in a skills based fashion that best resembles outdoor climbing. That means climbing outdoor style boulders or roped climbs (moonboard, baby!) with some level of feedback. Doing this in tandem with focusing on as many of the important variables that apply to your discipline and season as possible. What does climbing with feedback look like? This could be self-assessing your climbing videos, watching YouTube videos of many beta options, climbing with stronger or more experienced climbers who are helpful, getting coaching from professionals, etc…
This analysis also promotes the idea that skill based workouts which incorporate some level of finger training will hit several of the important variables at once (without sacrificing skill building for strength gains). This is something that has been prevalent in the history of climbing, and has resurfaced more and more recently. It's a breakthrough to finally see it in a non-testimonial way, expressed through statistical analysis and testing.
All of this will promote growth faster than the typical 2 hour gym session where you hang out and eventually try a hard boulder a few times. On a side note, having fun is the key to not burning out, and we wish there was a metric for that in here!
These results can also help put an end to the constant complaining about team kids flashing your project. Now that we know that variables like weight or height are not significant in the long run, I would daresay that one of the main reasons youth team kids get better quickly is because they climb in a structured way, with a coach giving them feedback, and have little open-minded sponge brains.

If there are two conclusions we can leave you with to increase your outdoor climbing grade, it is to maximize improvement in the significant variables discussed above and prioritize time on rock. Two great avenues for this is to have a coaching mindset and seek out on-the-wall training ideas. That could mean being a self-taught student or hiring a coach, both are great! There are many insightful, free resources as well as paid skills coaching and on-the-wall training from a variety of incredibly talented coaches.
At Project Direct Coaching, we have and will continue to focus on skill development, on-the-wall workouts, and data-driven analysis in all of our plans. We also want to give a huge shoutout to Power Company Climbing for taking the time and energy to collect this data and for working with us to get to the bottom of it.
If you want to see how well the regression model fits you, head to our climbing predictor and input all the variables we wrote about.
About the authors:
Casey Elliott is currently pursuing a MS in Materials Science and Engineering in Reno and has worked in the climbing industry for almost 10 years. His psych for exploring the outdoors through climbing and skiing is only matched by his love of sharing that with others. He coaches for Project Direct Coaching.
Karly Rager holds a MS in Structural Engineering and is the founder and head coach of Project Direct Coaching. She loves climbing, traveling, and is stoked to belay anyone who wants to try hard.


*A note on our process:
We do need to discuss the sample size and distribution of this data set. For this kind of analysis, ideally we would have something called a normal distribution (bell-shaped curve, as it is also known) of data points, meaning that we collected data from what we would consider the full spectrum of possible responses. However, this data set does not include enough people who are true beginners or enough of the best in the world. Meaning, it isn’t a totally normal distribution and our analysis would benefit from more surveys from beginners and very elite climbers.
One of our goals is to create a more robust data set so that we can be more conclusive in our assessment. Because we do not have this totally normal distribution of responses, the data may be prone to debate. Along with this, the data set had to be reduced to 238 climbers to include all the variables that we wanted to take into consideration for the multi-variate analysis. (Climbers contributing were self-reporting and could leave variables out of the data set. In this case, their data could not be used because it didn’t incorporate all variables). the full data set (600+) climbers was used for the single variable analysis.
We found that gender did not play a significant role in influencing the data (less than 5 percent difference in correlation across metrics when a scatter plot + regression models of one variable at a time were considered). Therefore, we assessed all genders together. This also allowed us to include those who did not specify their gender as male or female. In order for the analysis tool to accurately assess the impact of each variable on a climber’s maximum grade, each variable must be present and accounted for.
We could have either chosen fewer variables that more climbers reported, or considered more variables for fewer climbers. We chose the latter so that we could analyze the importance of many variables (and because we had already completed the single variable analysis with the larger data sets) and ended with a data set of 238 climbers. For future research, it would be incredible to survey thousands of climbers from all styles and grades, indoor and out, and see what shines through.